
Despite these fluctuations, Bitcoin’s supremacy in the market is undeterred, holding firmly to its number 1 position in CoinMarketCap. Its current market cap is $665.9 billion. Speaking of supply, there are 19.53 million BTC coins in active circulation, with a cap set at 21 million BTC coins.
Immerse yourself in our complete Bitcoin price prediction to unpack the factors influencing BTC’s current position and what the future potentially holds.
Bitcoin price prediction
Diving into the daily chart for our analysis, Bitcoin’s pivot point is marked at $33,920, which interestingly coincides with the 23.6% Fibonacci retracement level. In terms of resistance levels, immediate resistance is at $34,500, followed by $35,250 and then $36,150.
On the other hand, immediate support is expected at $33,000, which aligns with the 38.2% Fibonacci retracement level. This is followed by support levels at $32,450 and $31,800, reflecting the 50% and 61.8% Fibonacci retracements, respectively.
📈 #Bitcoin Daily Technical Outlook 🚀:
Current price: $34,100
24-hour trading volume: $18.37 million
RSI: 57 (bullish sentiment 🟢)
Price above the 50-day EMA ($32,800) indicating a short-term bullish trend.
Immediate Resistance: $34,500 Stay informed and trade wisely! 🔍📊 #BTC #CryptoUpdate pic.twitter.com/otsCgCu7TA— Arslan B. (@forex_arslan) October 29, 2023
From a technical point of view, the Relative Strength Index (RSI) value stands at 57. This value, slightly above the midpoint, reflects a bullish sentiment in the market, showing a prevailing buying impulse.
Additionally, Bitcoin’s 50-day exponential moving average (EMA) is recorded at $32,800. Since the current Bitcoin price is hovering above this EMA, it indicates a short-term bullish trend.
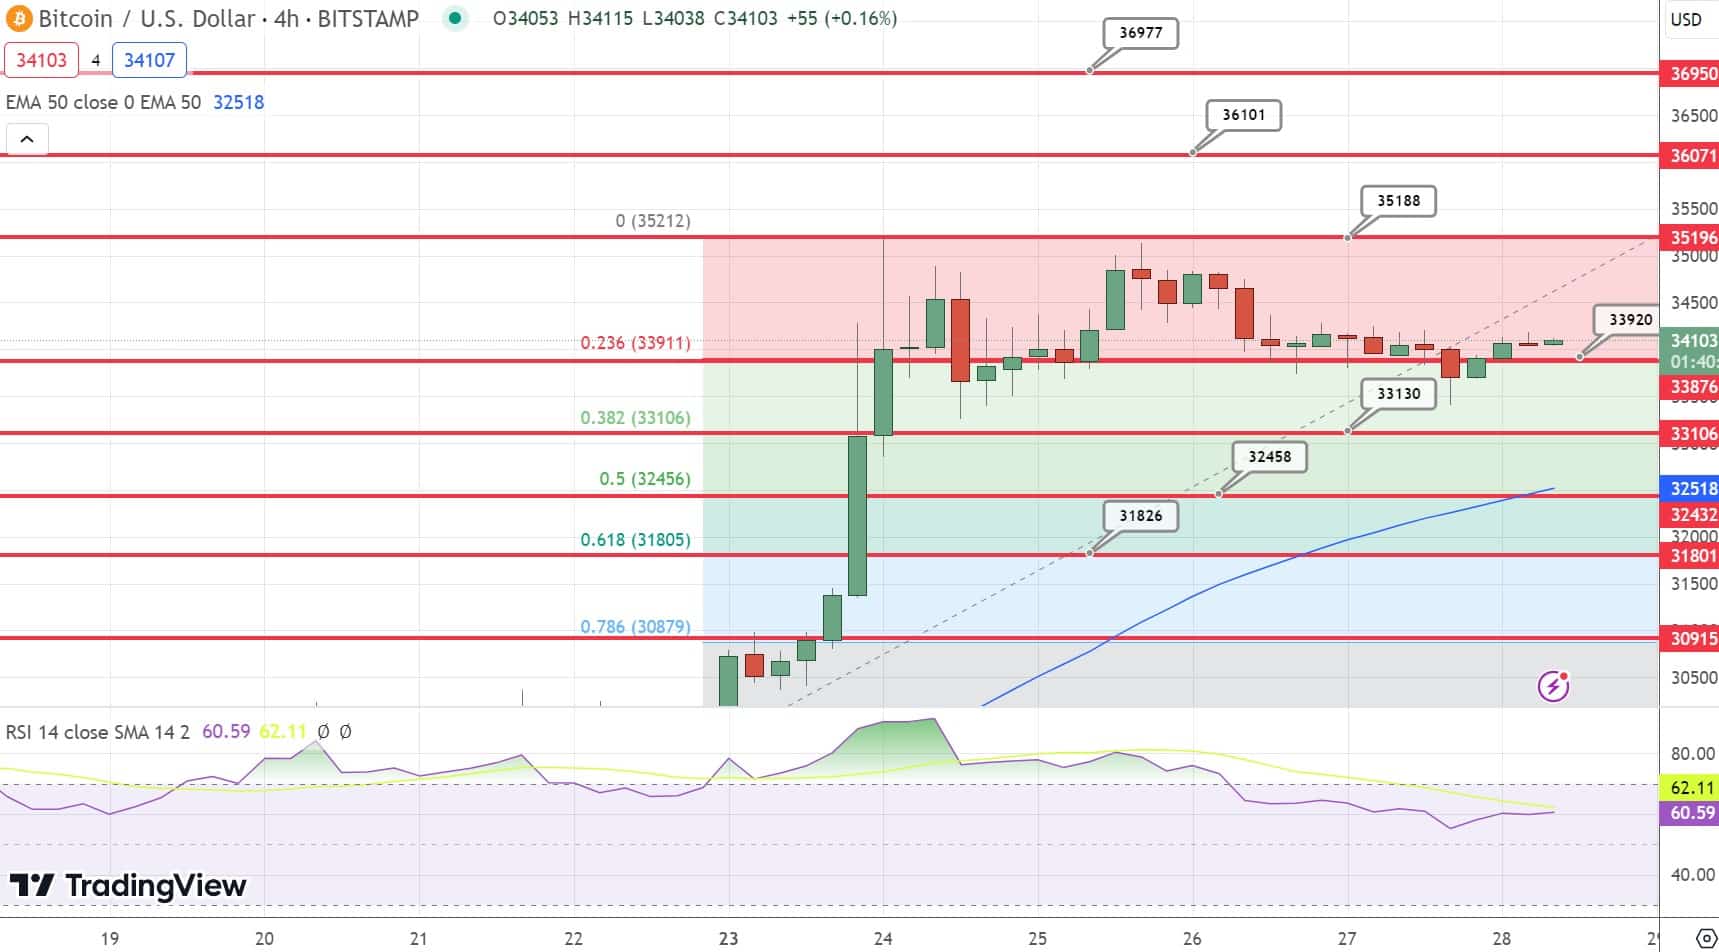
Looking at the patterns on the daily chart, Bitcoin appears to be in a strong position, holding steadily above a lower double support level at $33,450. Also, the 23.6% Fibonacci level stops any substantial downtrend.
An obvious red box on the chart indicates a consolidation phase, suggesting that investors could be waiting for a solid reason to trigger a significant breakout.
summing up
In conclusion, the overall trend of Bitcoin is tilted to the upside, especially if it manages to break above the $33,900 threshold. Conversely, if it breaks below this level, there could be a bearish trend on the horizon.
Given the current indicators and market pulse, it is plausible that Bitcoin will attempt to test the $34,500 resistance level in the coming days.
However, it is essential that traders remain vigilant, keeping in mind both technical markers and overall market conditions, as the crypto domain is notoriously volatile. Making informed decisions based on a combination of these indicators is always the most prudent approach.
Top 15 Cryptocurrencies to Watch in 2023
Stay up to date with the world of digital assets by exploring our collection of the 15 best alternative cryptocurrencies and ICO projects to watch in 2023. Our list has been selected by industry talk professionals and crypto newsensuring expert advice and critical insights for your cryptocurrency investments.
Take this opportunity to discover the potential of these digital assets and stay informed.
Disclaimer: The cryptocurrency projects endorsed in this article are not the author’s financial advice or editorial publication – cryptocurrencies are highly volatile investments with considerable risk, always do your own research.